A home is asking $700,000 and the valuation says $800,000. Can you count on a $100,000 saving? In our sales data, homes priced well below valuation mostly sold close to asking. More of the gap held up when the valuation had higher confidence, but most of it disappeared by sale.
- Homes with valuations 15-30% above asking sold roughly at asking.
- They sold above asking more often than homes asking more than their valuation.
- About 22% of the gap showed up in sale prices for High-confidence valuations, falling to about 14% for Medium and 8% for Low.
- Beyond a gap of about 15-20%, a bigger gap stopped helping.
- Deal Finder uses the share of the gap that held up in past sales, alongside growth, yield and genuine price cuts.
See it on a property page
Follow a Deal Finder search
The tutorial follows Queensland houses under $400,000, then checks the top pick on its property page.
Watch the 2-minute tutorialWhat happened to listings priced below valuation
We analysed 108,565 recorded sales from 1 March to 17 October 2026 with an asking price and estimated valuation from during the listing.
The median home sold for about 2% below asking. Homes with valuations well above asking sold a little better, though still much closer to asking than valuation.
In the table, a sold/asking ratio of 1.000 means the sale matched asking; 0.980 means it sold 2% below asking. The bands show the valuation relative to asking.
| Valuation vs asking | Sales | Median sold / asking | Median sold / valuation | Sold above asking |
|---|---|---|---|---|
| 10%+ below asking | 11,482 | 0.964 | 1.137 | 19.9% |
| 5-10% below | 14,780 | 0.963 | 1.037 | 17.6% |
| 0-5% below | 25,956 | 0.971 | 0.996 | 21.6% |
| 0-5% above | 24,348 | 0.985 | 0.963 | 34.2% |
| 5-10% above | 15,168 | 1.000 | 0.930 | 44.7% |
| 10-15% above | 7,805 | 1.003 | 0.897 | 52.4% |
| 15-20% above | 3,905 | 1.009 | 0.863 | 55.8% |
| 20-30% above | 3,062 | 1.012 | 0.820 | 55.9% |
| 30%+ above | 2,055 | 1.002 | 0.722 | 51.1% |
Where valuations were 15-30% above asking, median sale prices were about 1% above asking and roughly 14-18% below valuation. About 56% sold above asking, compared with about 20% of listings asking more than their valuation.
Past about 15-20%, a bigger gap brought no further improvement in sale prices, and the 30%+ band finished slightly worse.
Why the gap mostly disappears
The asking price can account for condition, renovation work, the agent's read of the street and what has happened during the campaign.
A valuation model uses property attributes and nearby sales. It may capture similar homes reasonably well while missing something obvious at an inspection. A low asking price may already allow for that difference, leaving the valuation too high for the home.
How much of the gap shows up depends on confidence
We measured how sale prices moved with the valuation gap for each confidence group. About 22% of the gap showed up for High-confidence valuations, compared with about 14% for Medium and 8% for Low.
| Asking price | Valuation | Confidence | Approximate amount of the $100,000 gap reflected in sale price |
|---|---|---|---|
| $700,000 | $800,000 | High | $20,000 |
| $700,000 | $800,000 | Medium | $13,000 |
| $700,000 | $800,000 | Low | $8,000 |
We also checked listings asking at least 5% below a High- or Medium-confidence valuation, matching Deal Finder's thresholds. Among 19,656 sales, the median gap was 9.8%. The median sale matched asking and was 9.6% below valuation.
For the 4,654 sales with gaps of at least 15%, the median gap was 20.4%, yet the median sale was only 0.7% above asking. Some 54.0% sold above asking.
Price cuts pointed to further reductions at sale
In an earlier study of 80,016 sales from March to October 2026, listings with a genuine asking-price cut in the last 90 days sold 1.3-1.6 percentage points further below asking than listings without a cut.
That gap is measured from the reduced price, so it comes on top of the cut itself.
How Deal Finder uses this
Deal Finder is a Pro feature. It lists properties asking at least 5% below a High- or Medium-confidence valuation that also pass data checks.
On 18 October 2026, we changed how it selects and ranks listings. Earlier versions ranked by gap size and could include a property based on its comparable-sales gap alone.
In the earlier 80,016-sale study, asking below the median of recent comparable sales added almost nothing to sale-price prediction once we knew the valuation.
Deal Finder now ranks by expected 12-month return. It combines the suburb's growth outlook for the dwelling type, the listing's rental yield, the suburb's house rental yield, the share of the valuation gap supported by past sales and an allowance for a genuine recent price cut. Denser apartment buildings score lower.
We scale the gap's contribution by valuation confidence and cap it where larger gaps stopped helping in the sales data.
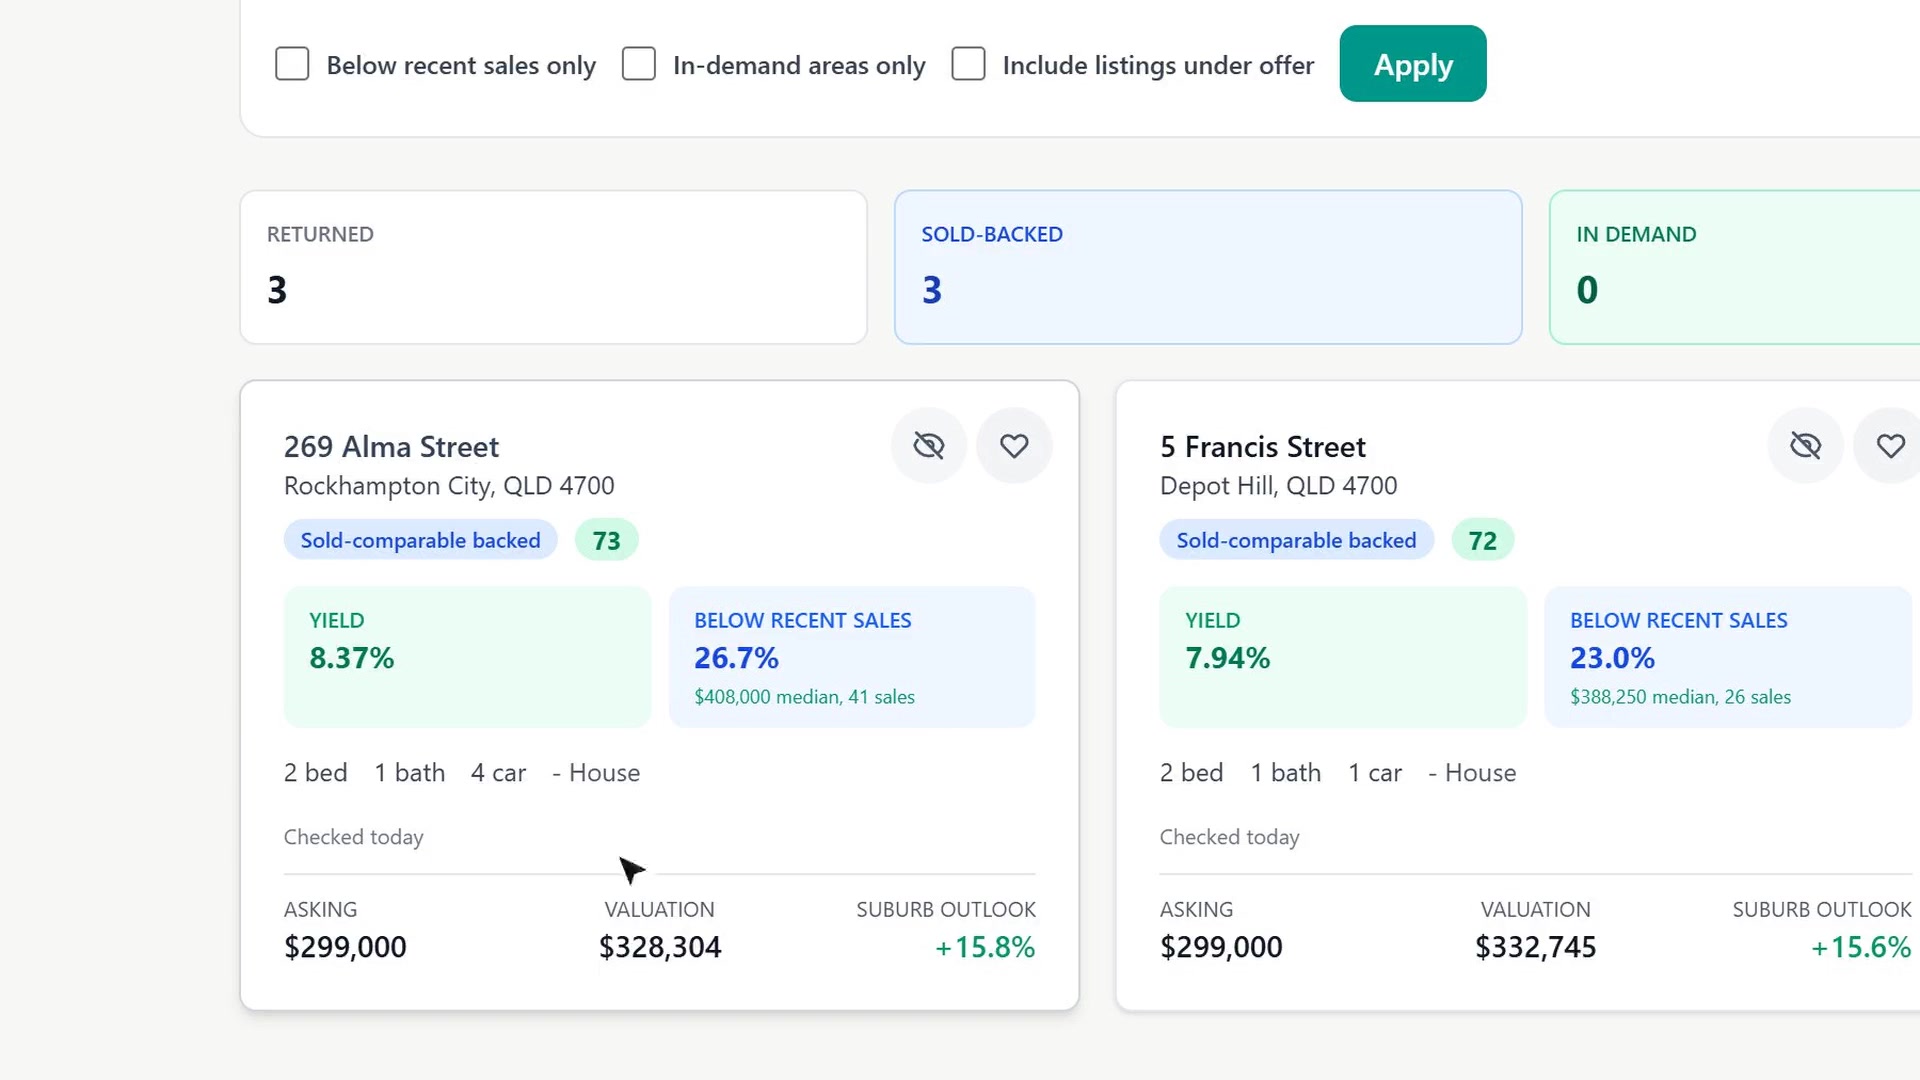
Each card shows asking, valuation and a "Below recent sales" figure. That compares asking with the median price similar homes in the suburb sold for over the last 24 months.
Cards also show a signal label - "Sold-comparable backed", "Clean valuation signal" or "Review valuation signal" - and when we last checked the listing. A badge marks a price cut in the last 90 days where applicable.
Under-offer listings are hidden by default. An unfiltered list includes at most three listings per suburb. The search starts in the state where most of your saved properties are.
What to check on a "cheap" listing
- Check valuation confidence. More of the gap held up in the higher-confidence groups.
- Compare recent sales. Look for differences in condition, renovation and location.
- Inspect the home. Work out whether those differences explain the asking price.
- Read the price history. Homes with genuine recent cuts sold further below their reduced asking prices.
- Read the contract and building reports, then decide what the home is worth to you.
These past sales cannot tell you what an individual home will sell for or what offer a seller will accept. Valuations remain estimates. The sold/asking ratio has been drifting over time, and asking prices can change during a campaign. We used the asking price held during the listing. We cannot tell why each valuation gap or price cut occurred.
How we calculated this
We analysed 108,565 recorded sales, sold from 1 March to 17 October 2026, with an asking price and estimated valuation from during the listing. Asking means the top of the advertised price. We calculated the gap as (valuation - asking) / asking.
We excluded sales below half or above 1.5 times asking, and valuations below half or above twice asking. The band table reports medians and the share sold above asking.
The confidence analysis used a log regression of sold/asking on valuation/asking. Slopes were 0.218 for High confidence across 42,884 sales, 0.140 for Medium across 26,967 sales and 0.084 for Low across 11,833 sales. The dollar example illustrates those relationships relative to an otherwise similar listing; the amounts are not suggested offers or predicted sale prices.
The price-cut and comparable-sales findings came from an earlier study of 80,016 sales from March to October 2026.
FAQ
Does a valuation above asking mean the home is underpriced?
In these sales, most of the apparent saving disappeared. Even where valuations were 15-30% above asking, median sale prices stayed roughly at asking.
Should I offer the asking price on a Deal Finder listing?
Listings meeting Deal Finder's confidence and gap thresholds had a median sale at asking. Use the inspection, contract, building reports and recent comparable sales to work out your offer.
Is the biggest valuation gap the best deal?
Larger gaps stopped improving sale-price results beyond about 15-20%. Deal Finder caps their contribution to its ranking there.
Why show "Below recent sales" if it added little predictive value?
It shows how asking compares with the median of similar homes sold in the suburb over the last 24 months. Buyers can check that comparison on the card; it no longer qualifies a listing for Deal Finder on its own.
Deal Finder is part of Pro
Find listings worth a closer look
Compare valuation gaps, growth, rental yield and recent price cuts with Deal Finder. A free account lets you browse listings and suburbs.
Explore ProKeep reading: How accurate are our valuations · Do properties sell above asking · Auctions vs private sales
Data: Recorded sales in PropRadar's database from 1 March to 17 October 2026. Deal Finder features described as at 18 October 2026.
This information is general advice only. It does not take into account your objectives, financial situation or needs. Property purchase and sale decisions carry real financial risk. Before acting on this data, consider your personal circumstances and consult a licensed financial adviser or real-estate professional.
Not sure where to invest? Take the 2-min quiz and we'll rank your top 10 suburbs.
Take the 2-min quizTurn market context into a shortlist
Compare live listings, suburb fundamentals, yield, cashflow and valuation signals before you inspect.